
Improving the drying of paper using TAD technology – Through Air Drying – and with the help of infrared radiation. A study presented by Aron Tysén at the Aticelca 2018 Congress shows the potential that can be found for tissue production.
The TAD (Through Air Drying) process for tissue paper has enabled manufacturers, from when it began, to supply products with high absorption and to reduce the weight, maintaining an excellent quality of product (Figure 1). There is no pressure, which means that thermal drying is used as from reaching a percentage of dryness between 24 and 32% until the sheet is considered dry. The absorption properties of tissue paper produced with TAD technology greatly surpass what can be obtained with other drying systems.

When the damp sheet, lain on the web, reaches the TAD cylinder, the water in the sheet is found for the most part in the inter-fibre pores and spaces as free water, with the remainder located in the lumen and in the inter-fibre micro pores.
Following the TAD cylinder, the sheet and the web are both exposed to the air, the temperature of which can reach ~ 250°C. In this way the wet fibres are in direct contact with the means of drying which permeates the sheet. The free water in the largest pores will, in part, be removed, carried along by the flow, whilst most of the water will require evaporation. The heat for the evaporation will be supplied from the air by convection, as the water inside the fibre is not easily accessible. The air will heat the fibre walls by convection and this drying energy will reach the inaccessible water by conduction and then by convection.
The combination of free water easily removed by the air flow and direct contact of the hot air with the wet fibres produces very high drying rates. On the tissue machine’s TAD cylinder, the drying rate varies from 170÷500 kg/(h∙m2), compared with 98÷170 kg / (h∙m2), measured on a Yankee cylinder.
The specific energy used is, however, much higher for the TAD process, nearly 30% more, because there is much more water to be removed thermally. The volume of hot air needed is significant, usually heated by burning natural gas, and needs large fans and pipes to carry it. This higher specific energy is costly and limits the machine’s productions speed.
A new study for TAD
In order to better understand the TAD process and thus be able to optimise it, a methodology was devised and developed by Aron Tysénand Hannes Vomhoff– InnventiaAB, Drottning Kristinas väg 61, SE- 114 28, Stockholm, Sweden. This methodology was based on high resolution thermography to study the dynamics of through air drying, measuring and analysing the most significant parameters of the process.
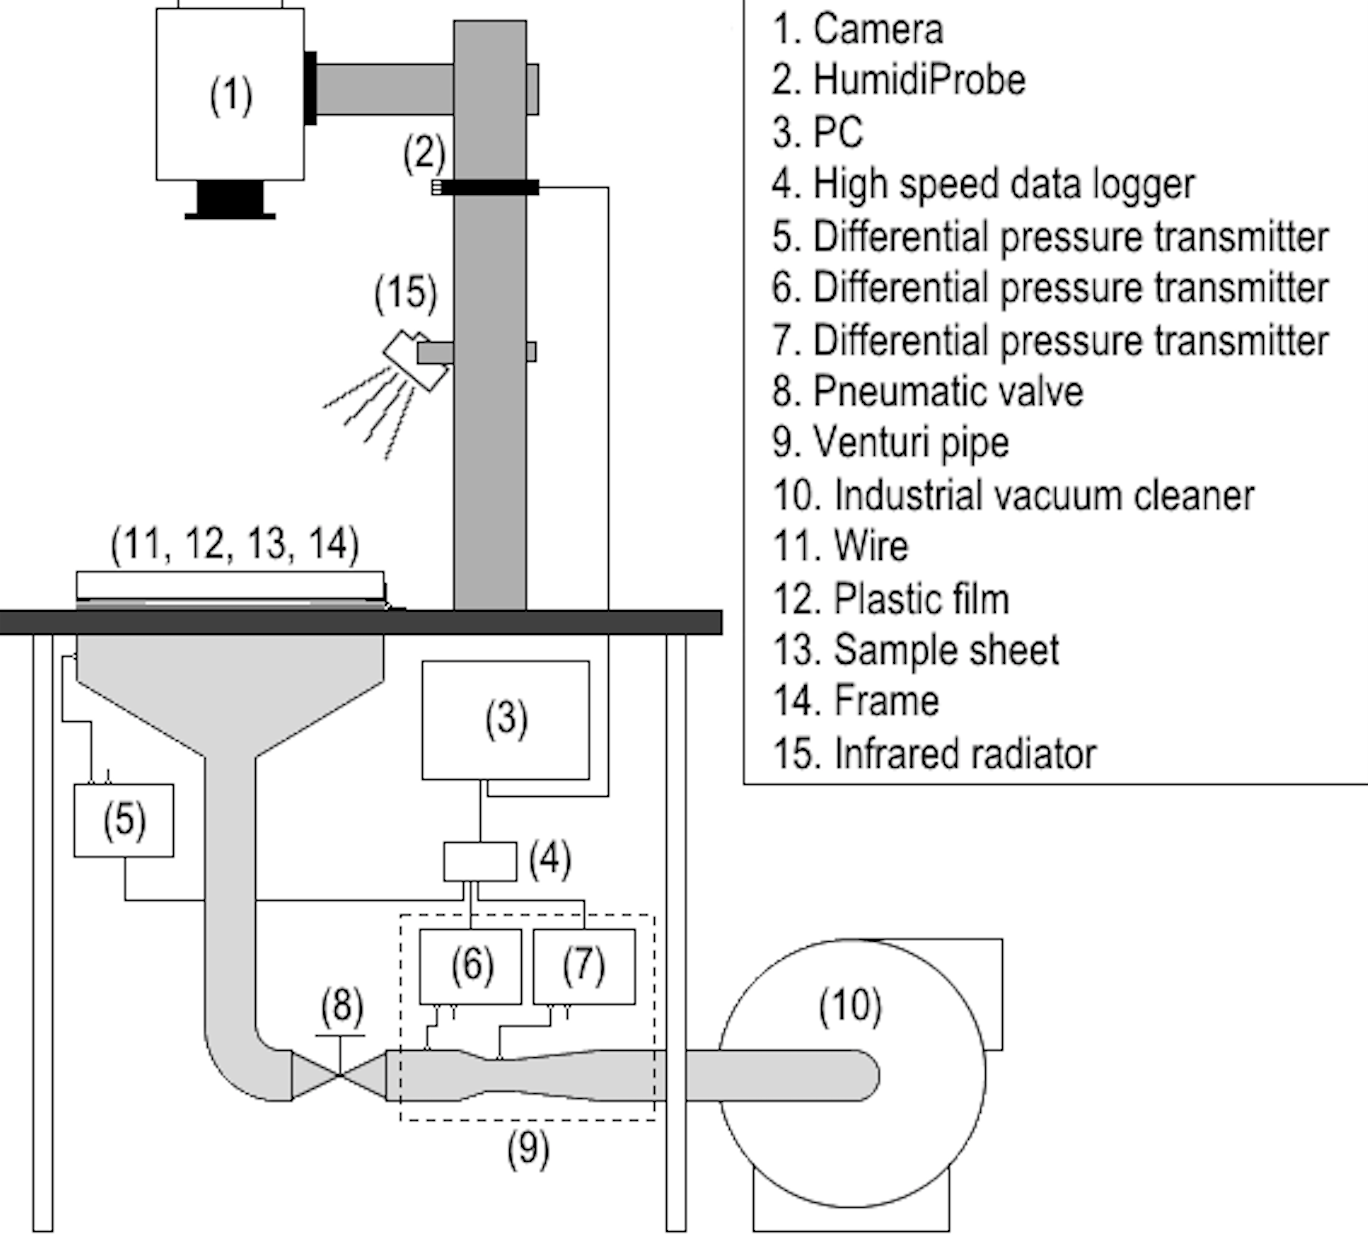
The study was carried out on a laboratory scale with equipment which simulates through air drying. A vacuum pump is connected to a web on which the sheets to be dried are positioned. A pneumatic valve between the vacuum pump and the web, when open, allows the air to flow through the sample at room temperature. The equipment is placed in an air-conditioned room at 23°C and 50% RH (Figures 2 and 3).
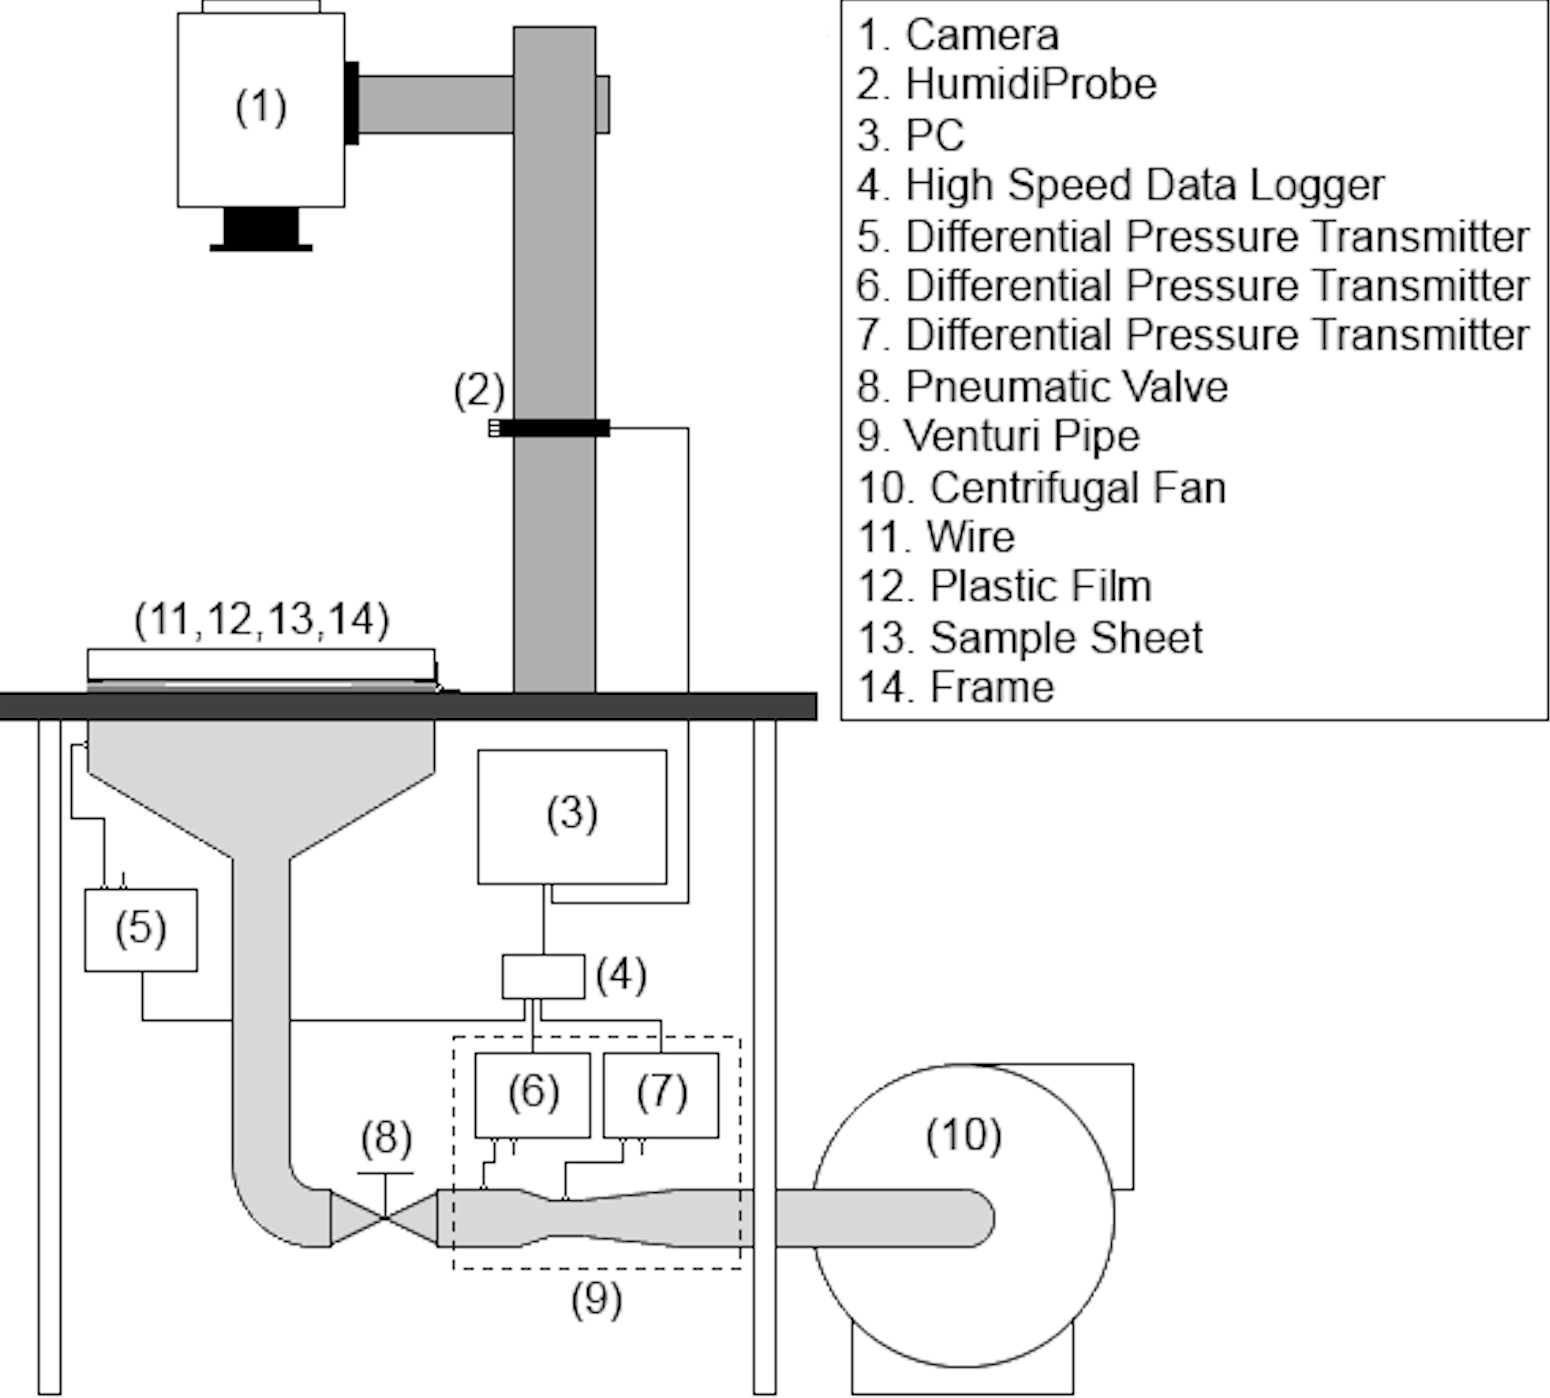
The air flow, calculated on the basis of the pressure levels measured with the Venturi tube, was recorded, together with the fall in pressure during the passage of the air flow between sheet and web. The temperature and humidity of the air after drying were also saved. The transitional temperatures in the surface area of the sheet were measured with the infrared camera and then recorded.
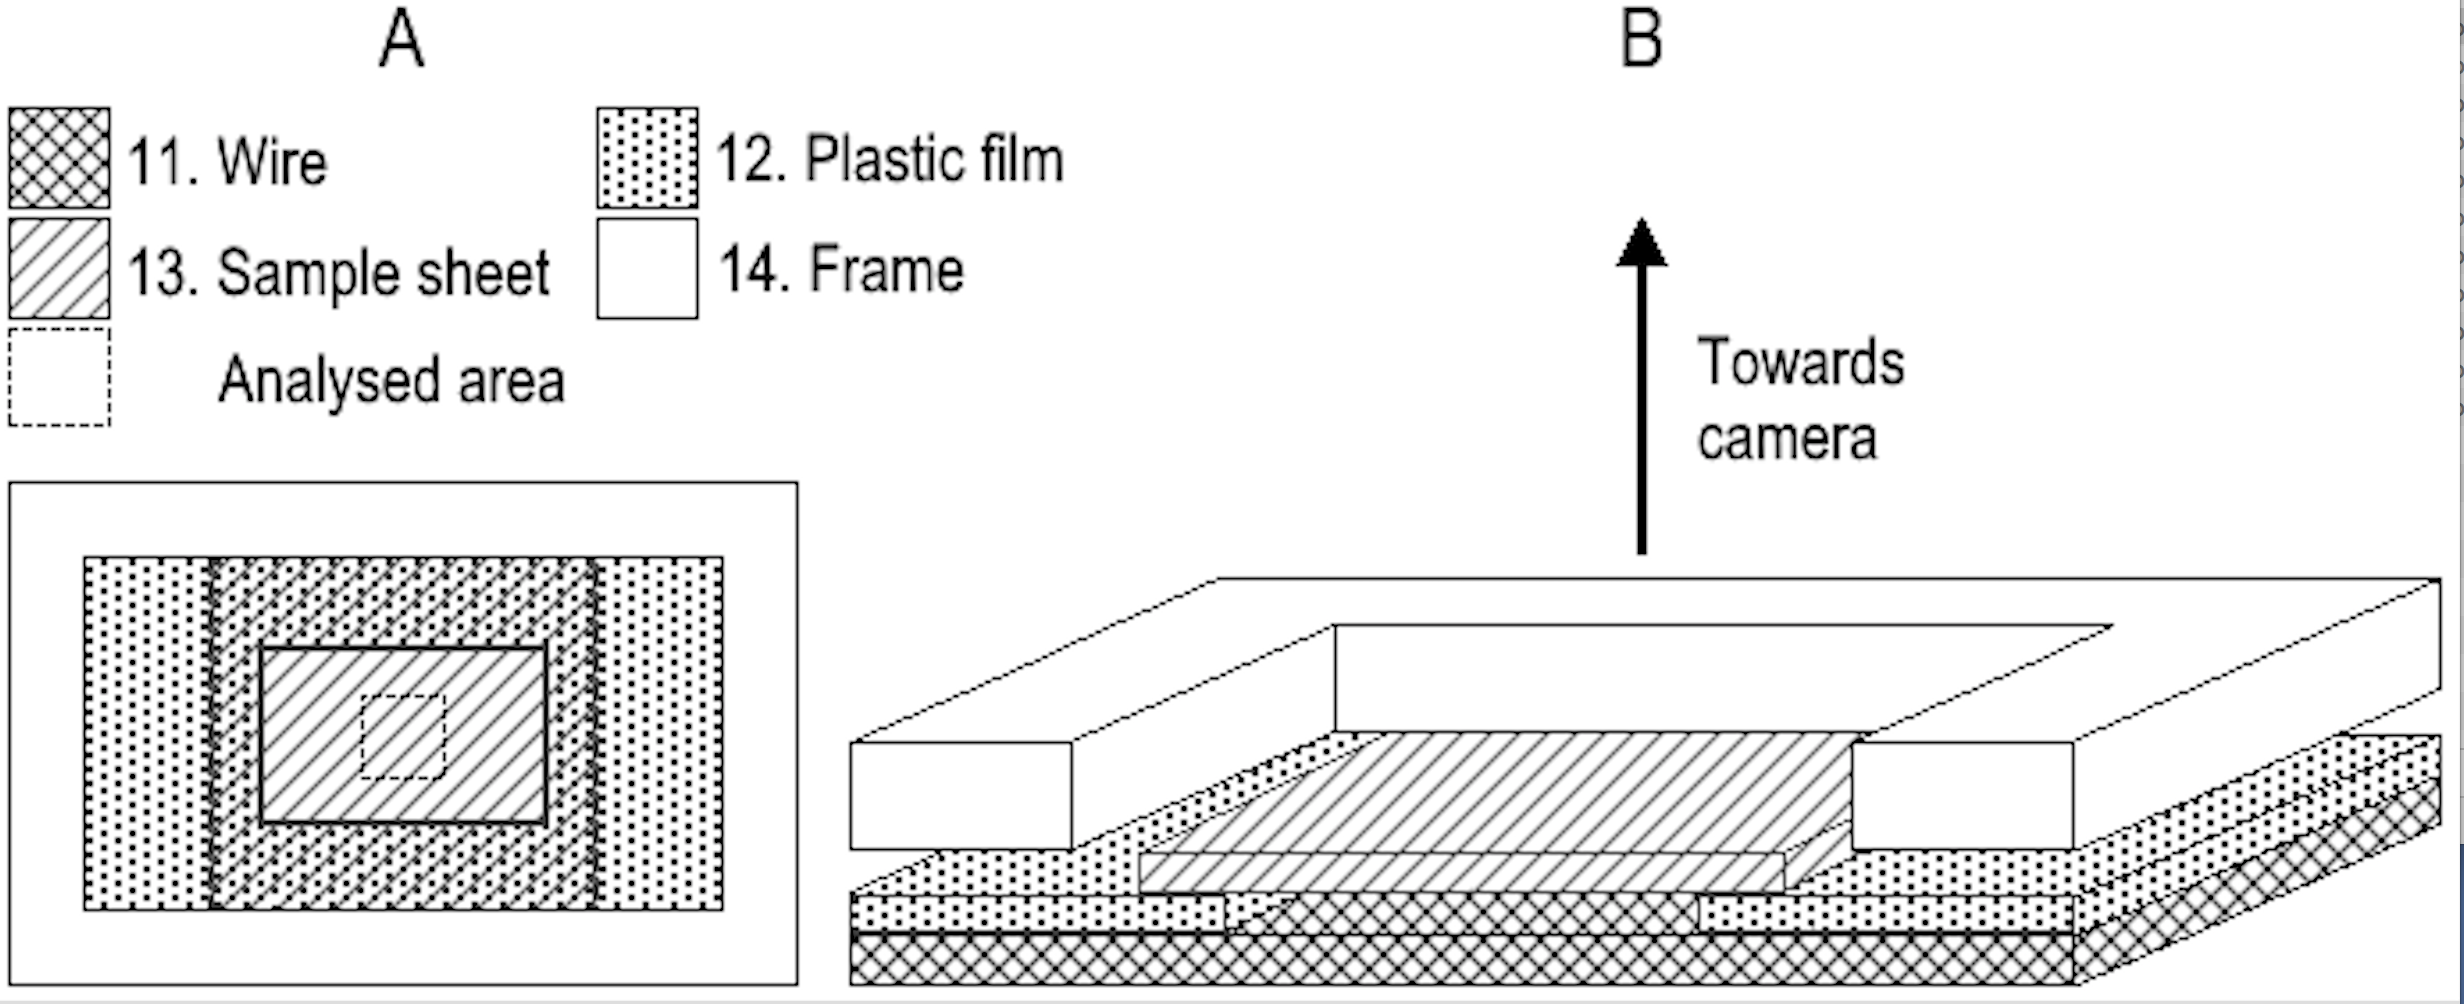
The sample is laid on a web, of the type used in TAD. Between the sample and the web, a thin plastic film with a square aperture defines the area subject to the air flow. The samples, web and sheet of plastic are held in a frame.
The data from the infrared camera is analysed and the pixels outside the analysed area are discarded so as to avoid the edge effect (Figure 4).
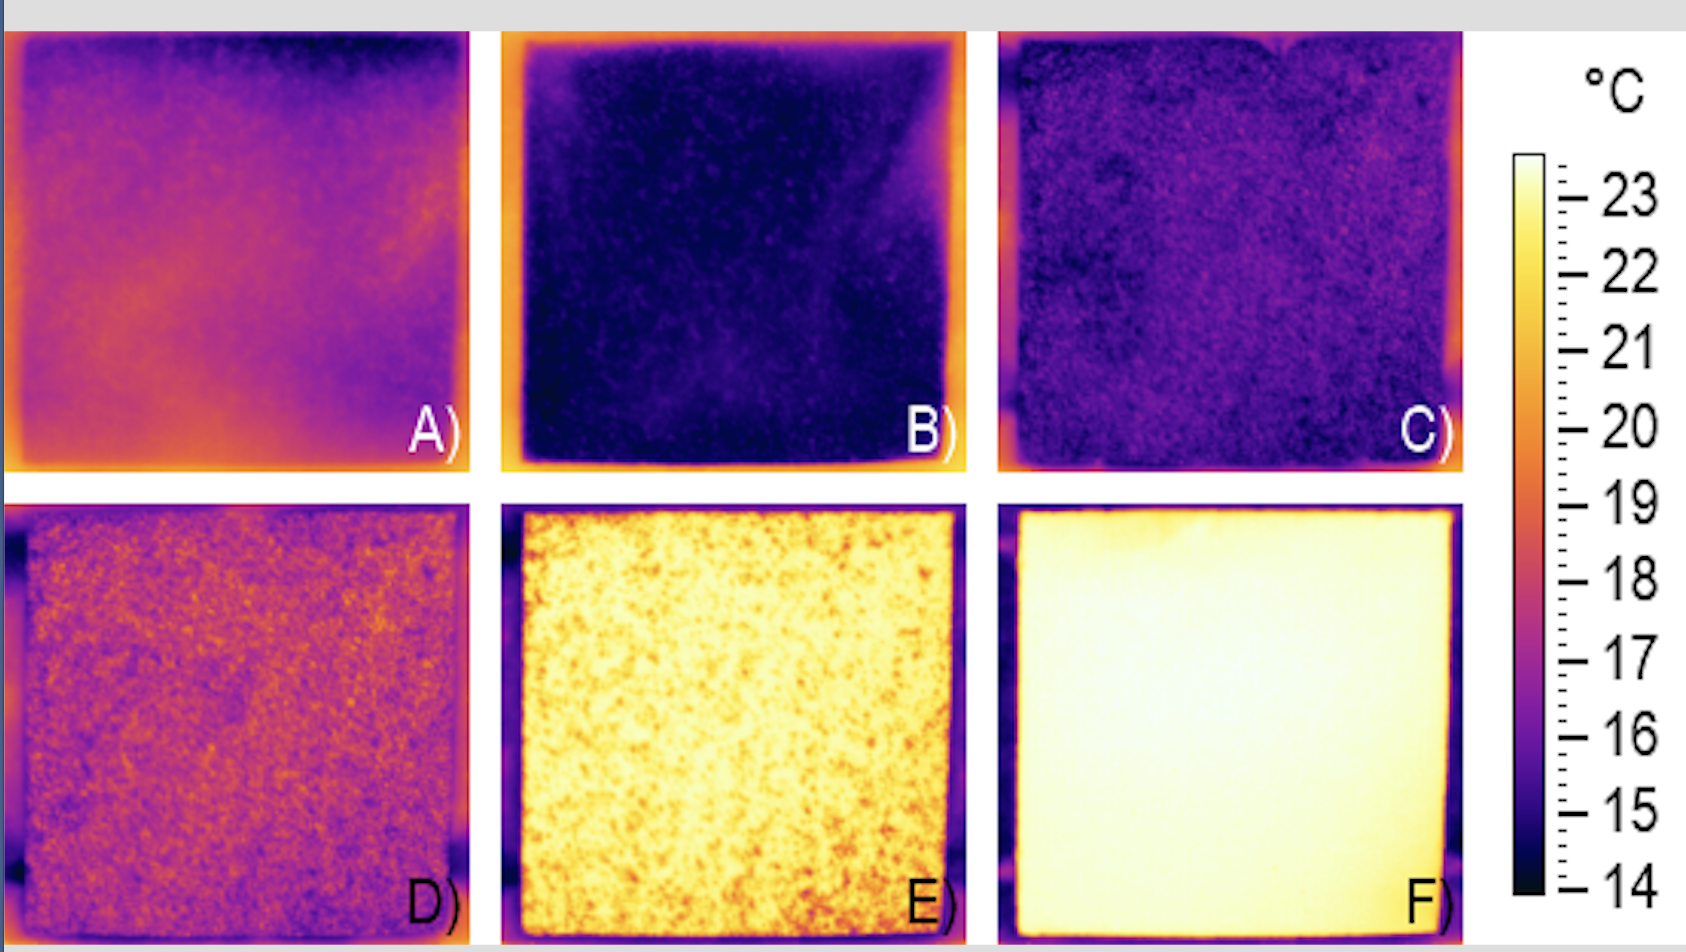
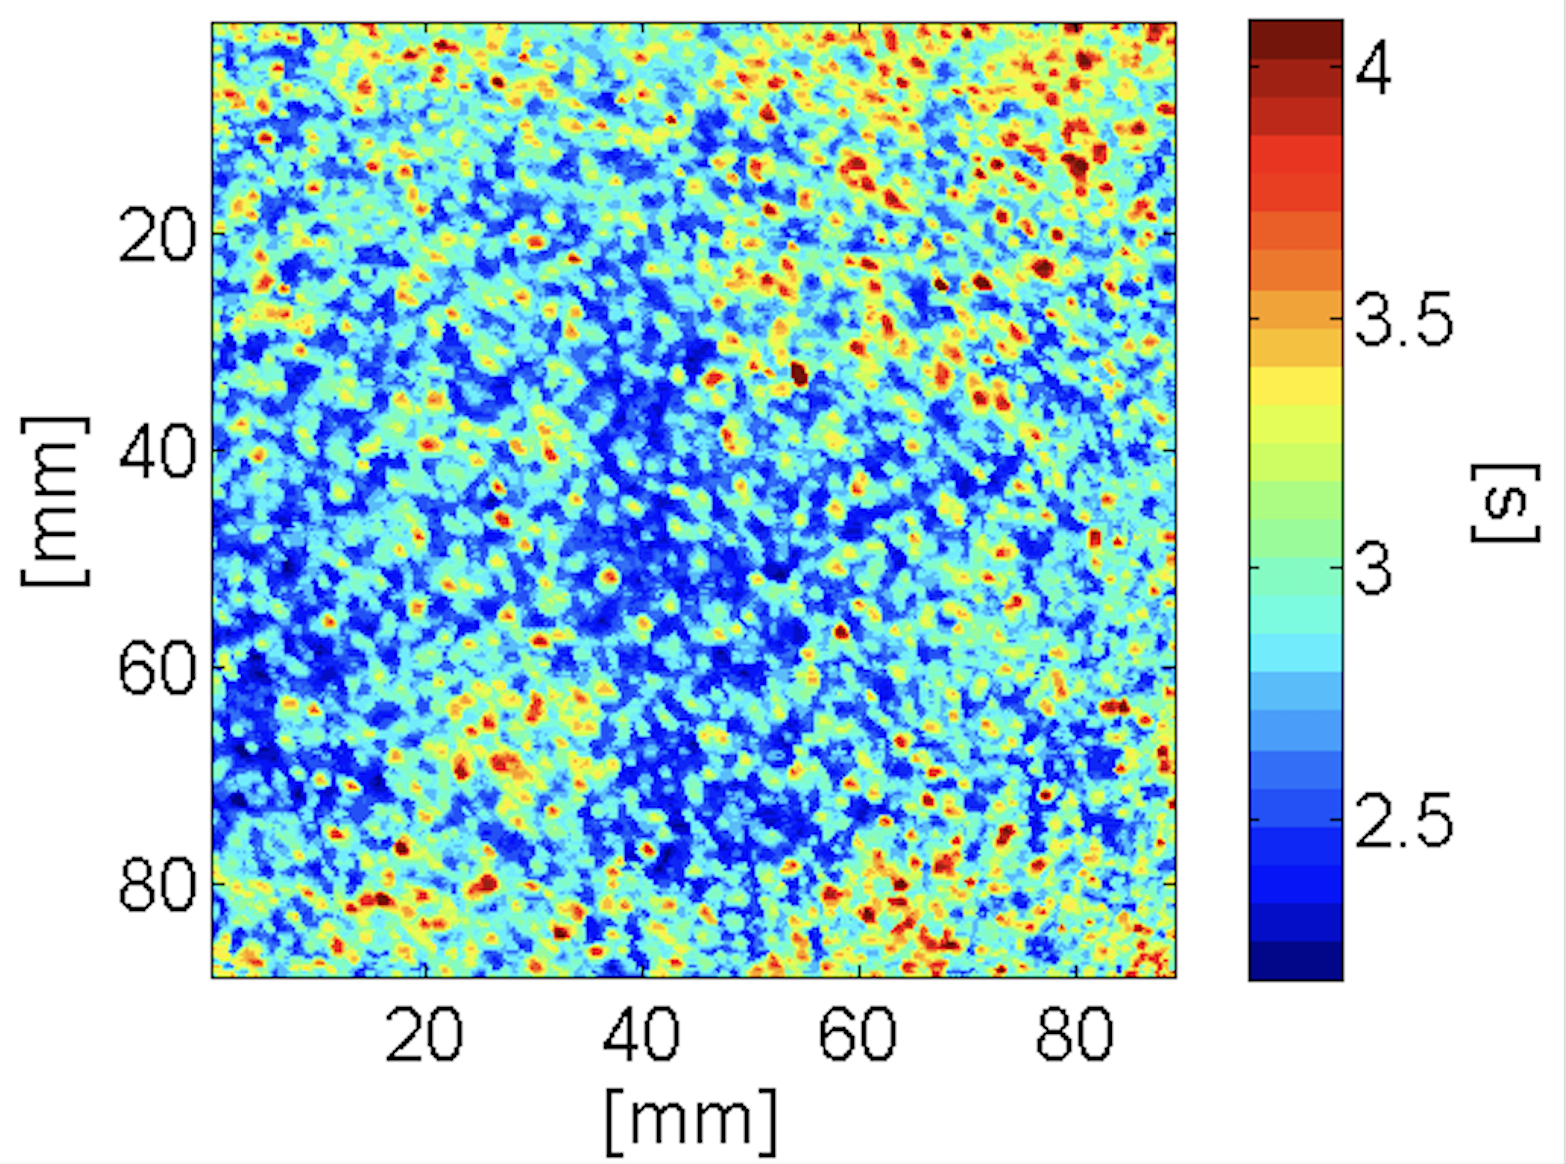
The endothermic nature of the drying makes the temperature of the surface reduce rapidly initially to the minimum and then increase slowly to reach the air temperature, when there is no more drying. The still photos represent the various phases of the drying sequence: (A) just before the start of drying, (B) lowest temperature, (C-E) slow increase of temperature, (F) drying completed and temperature constant. From the stills it is possible to see how the local non-uniformity of temperature seems to reduce significantly when drying is complete.
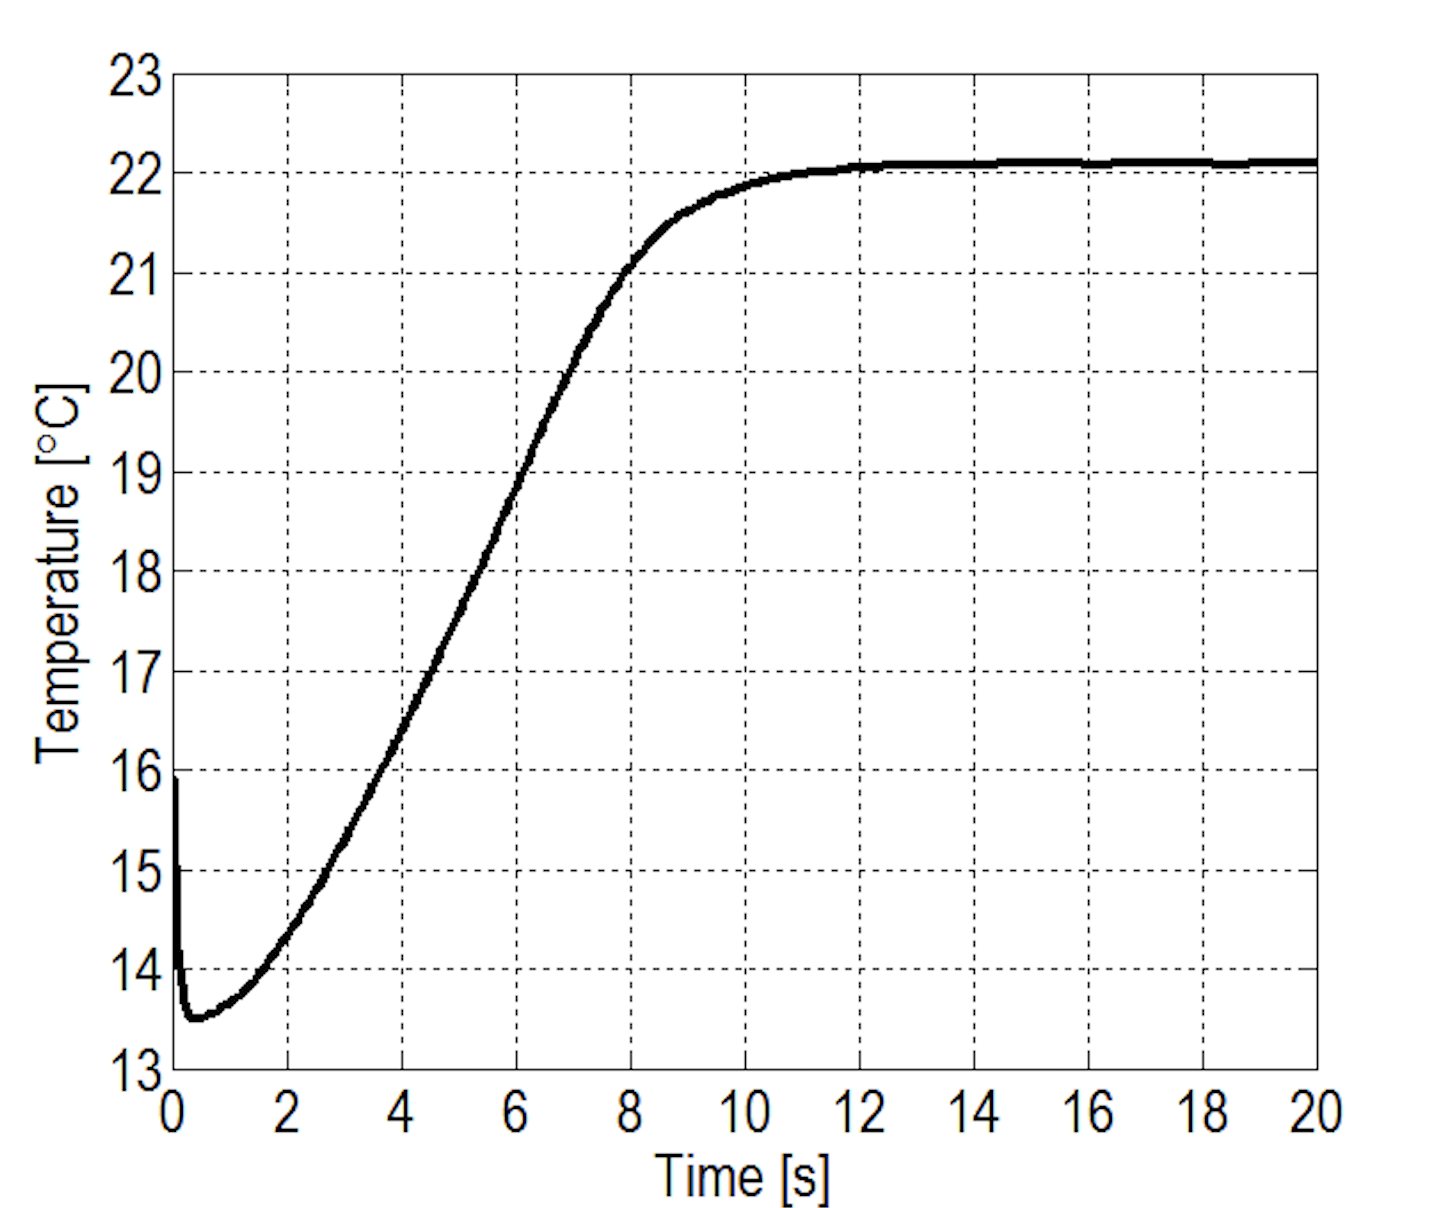
It is possible to obtain, in addition, an average temperature curve measured during the drying process (Figure 5). The data is also used to determine the drying time. The sheet is considered dry when the temperature starts to stabilise at its highest value.
Drying times
Various pulps and weights were studied, using the respective performances of the temperatures, in order to determine the average speed and drying times; whilst in order to determine the permeability, data from the air flow and fall in pressure have been used.
In order to discover the amount of water removed from the samples, the input and output weights and dryness percentages were determined gravimetrically.
By knowing the drying time, weight and water removed, it was possible to calculate the specific drying speed per unit of mass – MSDR: kg of water removed/hour and kg of fibre.
In order to assess the energy efficiency of the drying process, expressed in kW/g, the specific drying speed per unit of mass MSDR was used, as an alternative to the specific drying rate per area – ASDR: kg or water removed/hour and m2–, usually used for the paper and cardboard drying process. An example will explain it: if on the same drying section the weight of the paper is doubled, maintaining the same quantity of water removed over time, the drying time will be doubled, but the ASDR value remains constant, whilst the MSDR is halved, thus giving a more extensive view of the fibre drying process.
Since the samples had to simulate tissue paper, which has a very low thickness and consequently a very high non-uniformity, as a percentage, a modified version of Darcy’s law was used to correlate with the fall in pressure of the air flow. In the theoretical calculation of permeability, the thickness of the sheet was replaced by the weight, also taking into account the permeability, thus modified, and the weight as resistance to the through air flow.
It was possible to find the resistance of each sample to the air flow which crossed it, measuring the air flow and fall in pressure with no sheet on the web and then subtracting it from that measured with sheet and web.
The thermographic method made it possible to investigate the influence of non-uniform distribution of moisture and density of the sample on the dewatering rates in air drying. Figure 6 shows a chart of drying times for a sample with a non-uniform formation.
Samples with a poor formation showed a clearer lack of homogeneity during drying, but this did not have an impact on the total drying time, contradicting some results reported in various papers. It was deduced that, with the relatively low levels of dryness of the sheets analysed, the formation has little or no impact on the drying time, since part of the water is present freely in the inter-fibre before drying.
The study has highlighted that the type of pulp and weight have an effect, having observed that during the initial drying of the sheet its speed of dewatering is influenced by the distribution and size of the pores and inter-fibre spaces and by their consequent draining at the start of drying. When a pore is drained of water it becomes a by-pass channel for the air flow and increasing quantities of air flow through the areas which are already dry, reducing the drying rate.
The tests also showed that the total permeability in the air of the web plus sheet is greater with coniferous pulps (SW) compared to those of broadleaved trees (HW).
The interaction between sheet and web also affects this; differences in drying times were observed with different types of webs because of the inter-fibre pores of the sheet which are blocked to a greater or lesser extent.
Results
The selection of pulps examined was made in order to have a large variety in terms of thickness of wall, diameter and coarseness of the fibres.
The samples were produced with various commercial bleached pulps: eucalyptus (UE), acacia (AC), spruce (SB) and a mix of spruce and pine (SE).
The weights varied between 15 and 60 g/m2. Analysing the data of the through air flows it was immediately clear that paper with a low weight, like tissue, behaves differently compared with that with a higher weight. The modified permeability increases with lower weight, but remains more or less constant with higher weights (Figure 7).
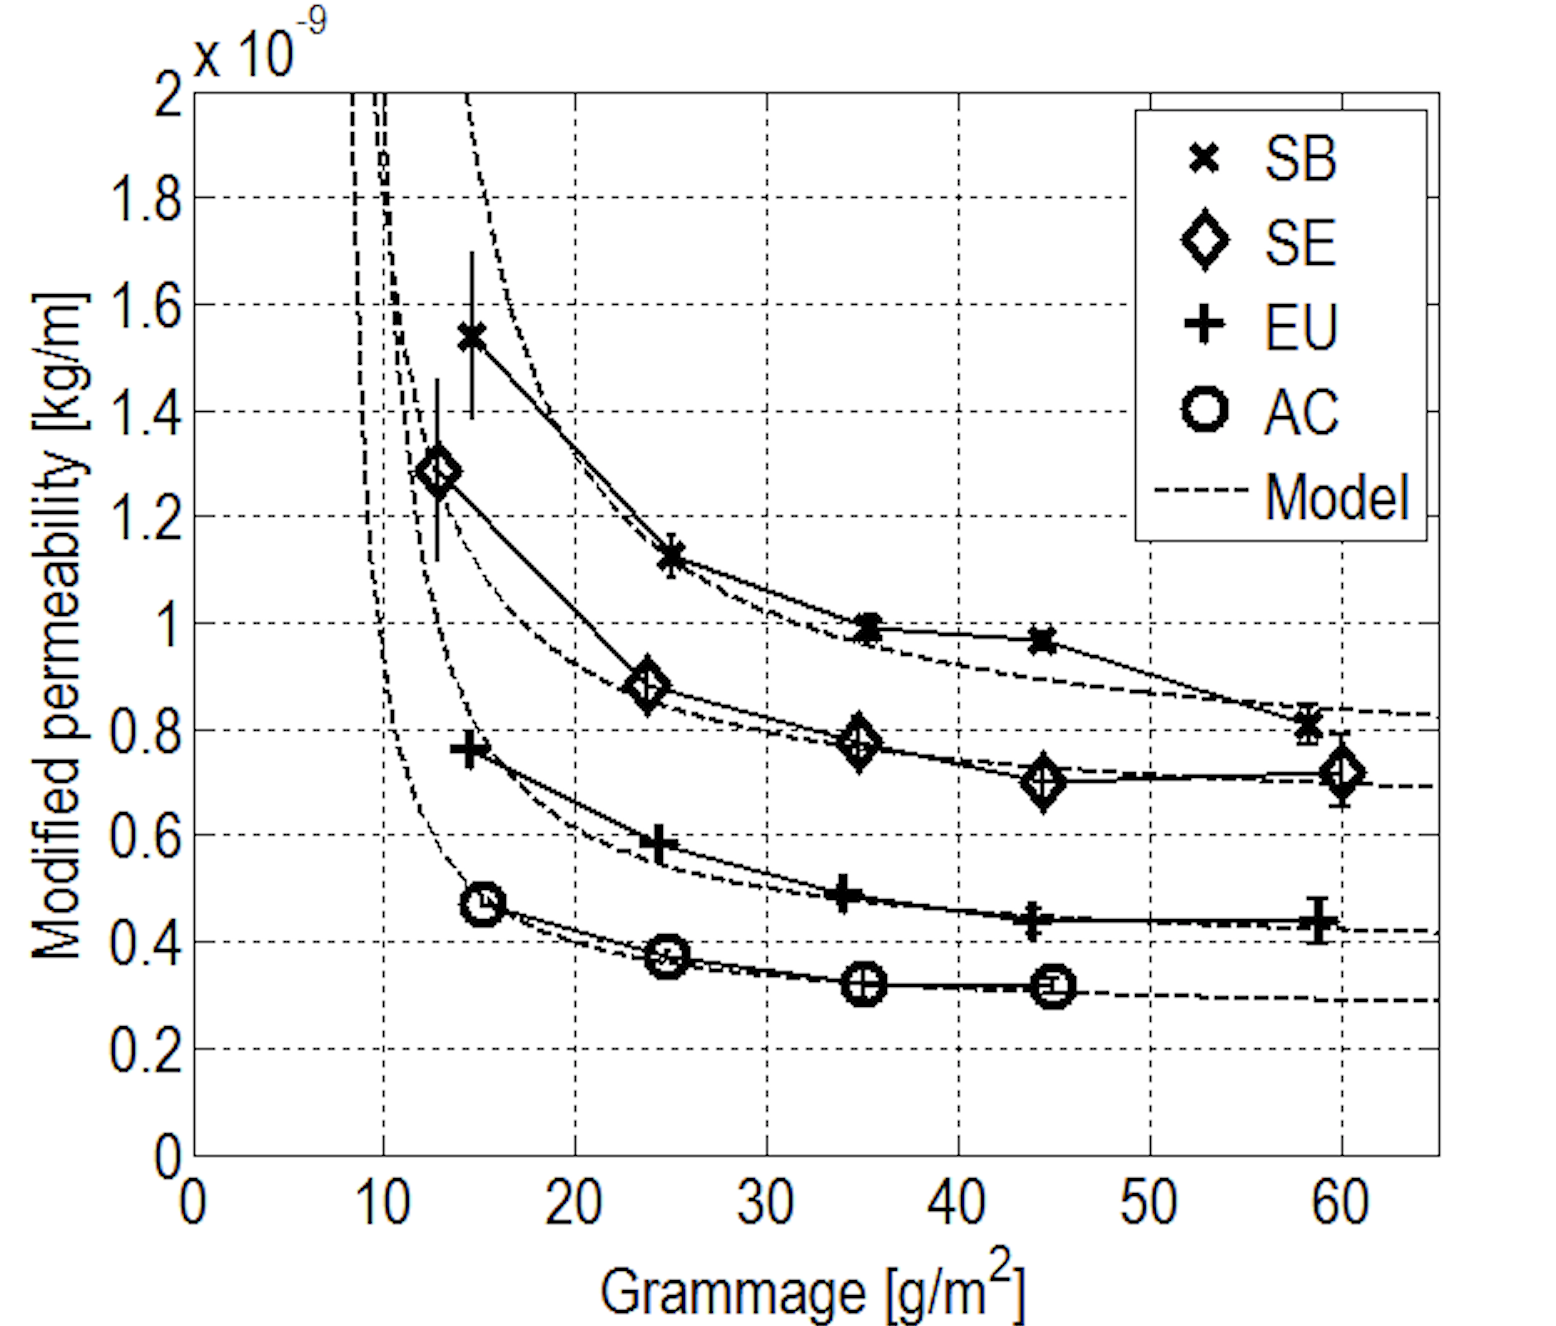
The permeability differences and consequently the air flowing through the samples of the four pulps, shown more clearly with the low weights, have highlighted the importance of the morphology and structure of the sheet.
However, when the specific drying speed of the mass MSDR was tracked according to the modified permeability, the wide range of permeability of the four different pulps with low weights did not have a clear impact on the MSDR values (Figure 8).
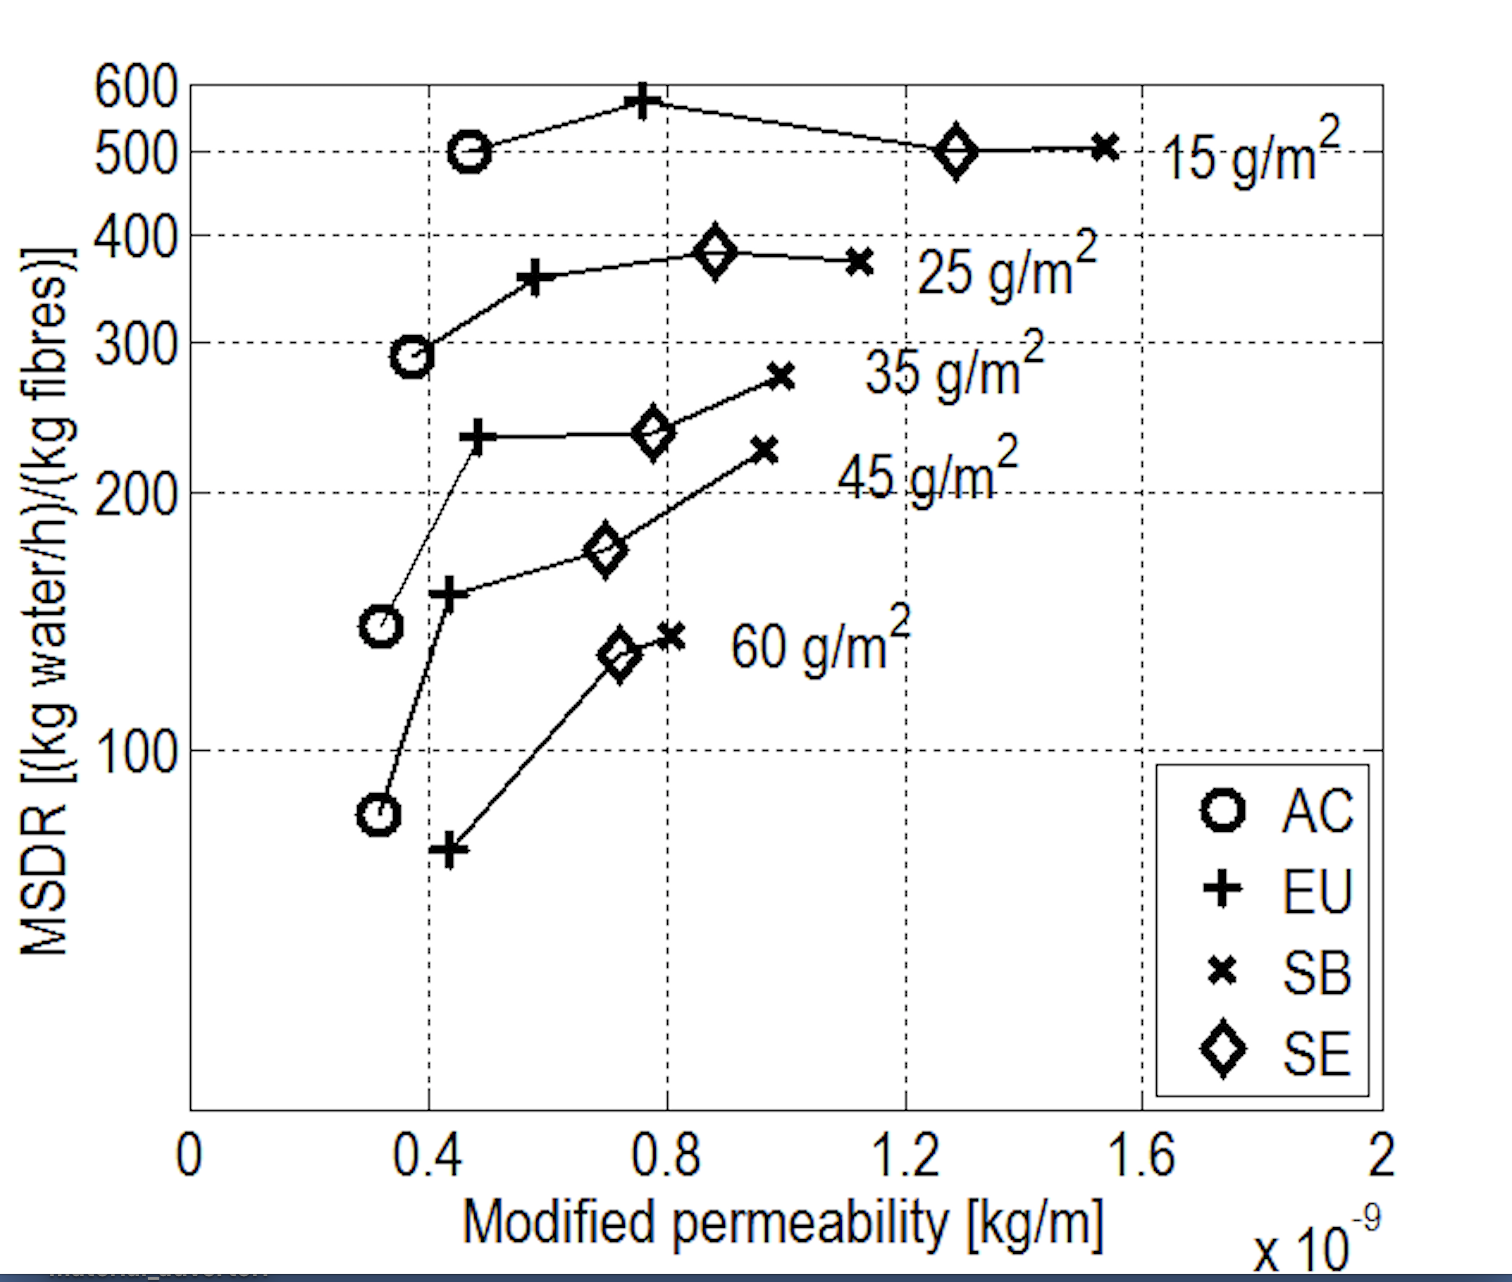
With the increase in weight, the specific drying rate of the mass MSDR became ever more dependent on the modified permeability; at the same time, surprisingly, it was shown that at low weights, despite the air flow varying greatly, the drying rate remained relatively constant. This shows and confirms that at low weights, the drying rate cannot be increased further with greater air flowing through.
After a deeper analysis of this limiting factor, it was hypothesised that it stems from an insufficient transfer of energy from the air to the fibre wall and thus through the fibre wall to the water to be evaporated. A conclusion which has highlighted the need to supply the drying energy in a different way from the hot air in order to obtain a more uniform drying, with less effect on the by-pass channels between the fibres. In order to add a more effective drying energy, the best solution chosen was that using infrared radiation. This radiation is well-absorbed by water and can spread through the direction of the thickness of the paper strip with fewer obstacles. It more easily accesses the water within the fibre wall, compared with convection air drying heating. The additional drying energy facilitates the evaporation of the inaccessible water, as in the micro pores present in the fibre wall.
In order to check this hypothesis, to the experimental equipment, a further piece of equipment was added for drying by infrared radiation (Figure 9).
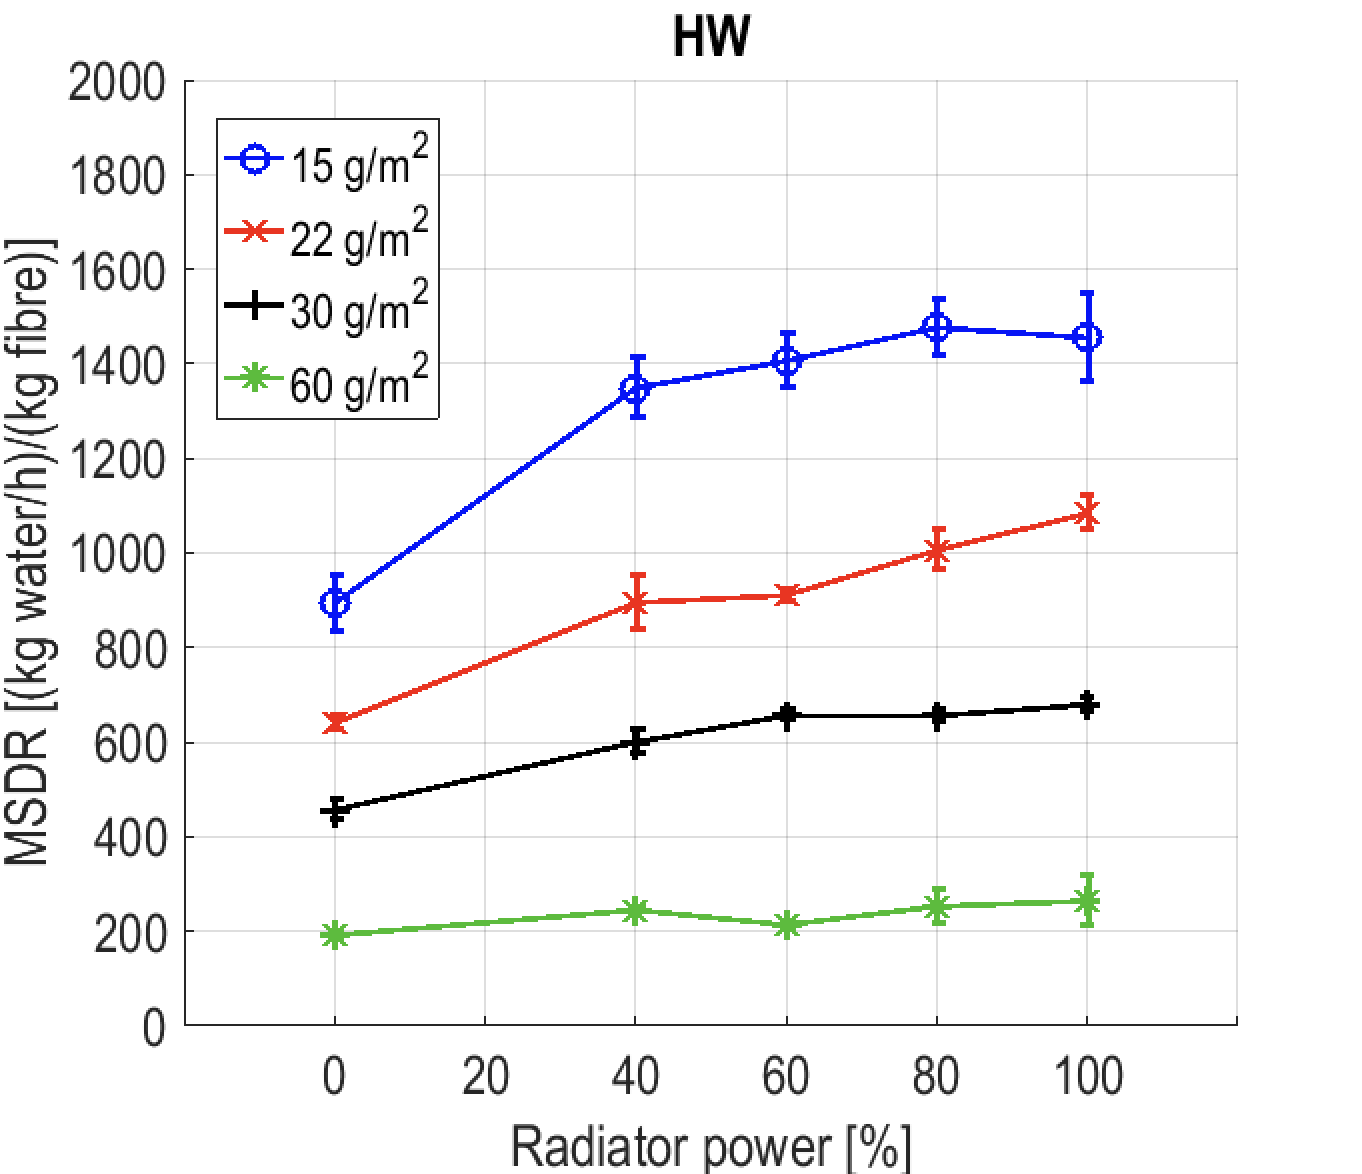
Figures 10 and 11 graphically display the specific drying speeds of the mass MSDR according to the power of the IR radiator, tracked through the coniferous (SW) and broadleaved trees (HW) samples, with different weights.
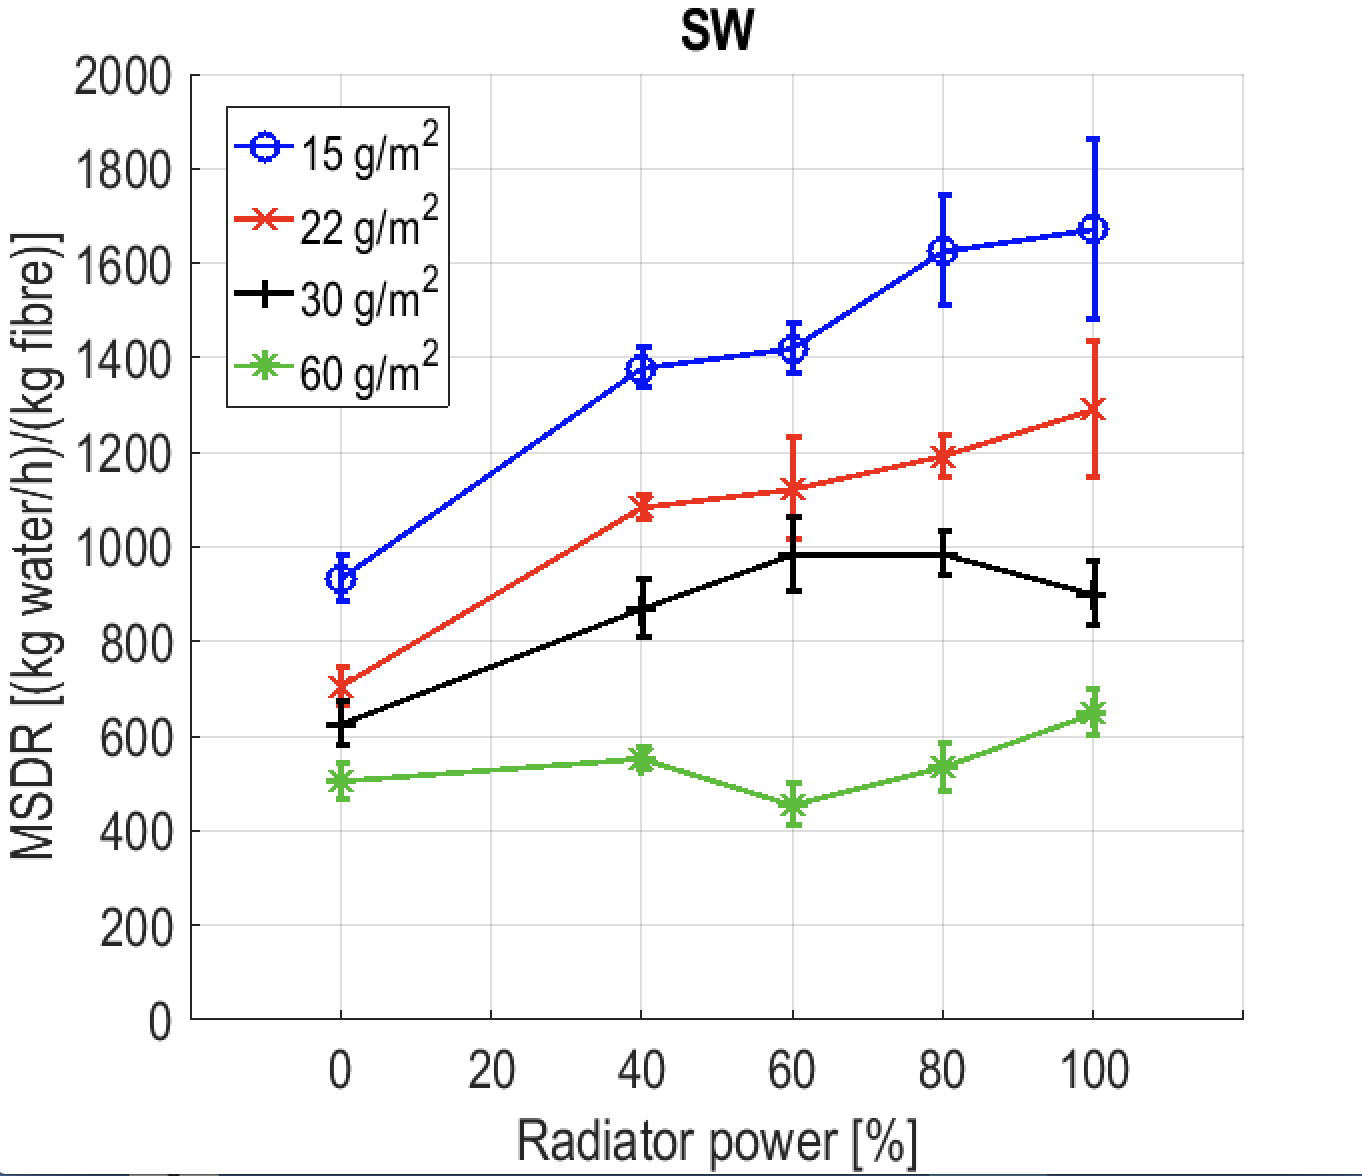
To define the reference values at zero power of the infrared heater, the preceding process was repeated using dewatering by air.
The addition of the infrared radiation increased the specific drying speed of the mass, but when the radiation was increased further, the improvement in the drying speed was not to the same for all weights.
For the lowest weights, which are used for tissue production, the MSDR initially increased, proportionate to the amount of infrared radiation, and then reduced gradually as the radiation power increased. More clearly, the MSDR values are not proportionally increased with the samples of all pulps with higher weights; with the increase in radiation they behaved, in fact, inconsistently.
This has revealed the need to find an optimal balance between the energy supplied through the air and that supplied through IR radiation. A balance to be identified between a not too excessive hot air flow and a not too excessive level of radiation power; this in order to make the dampness evaporate more quickly with good energy efficiency.
The temperature data collected with the infrared thermal chamber, was also used to determine how much energy was used for drying the paper. The energy transferred from the air to the sample over time was estimated by combining the product of the specific energy of the air, multiplied by the flow and by the difference in air temperature, at the start and after drying. What was measured and compiled was compared with the energy theoretically necessary to evaporate the mass of water removed, based on the latent heat of vaporisation (Figure 12).
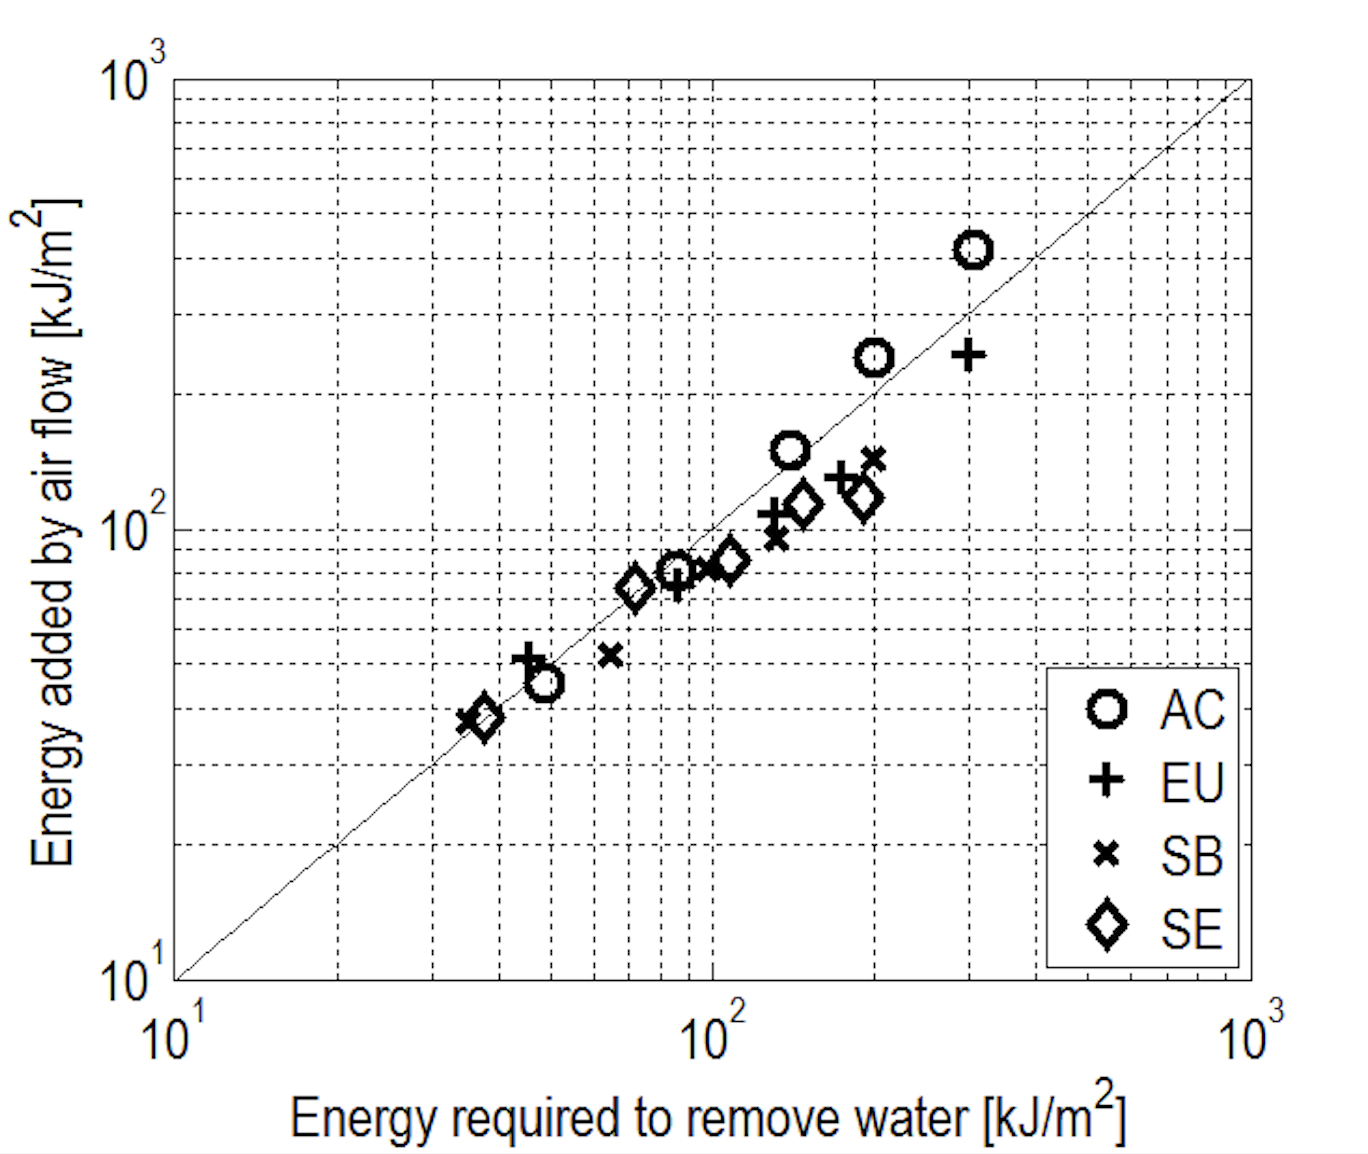
The tests showed a good correlation between the energy estimated theoretically and the energy revealed in the test. To explain the limited discrepancies and values under the theoretical curve, it was hypothesised that part of the water did not evaporate, but rather was carried away by the air flow.
The same calculation was carried out for the samples in the drying tests with infrared. The IR radiation energy which reached the sample, was added to that by air, without radiation. The sum of the energies was multiplied by the drying time and divided by the mass of water removed; thus an energy per gram of water removed (kW/g) was obtained (Figure 13).
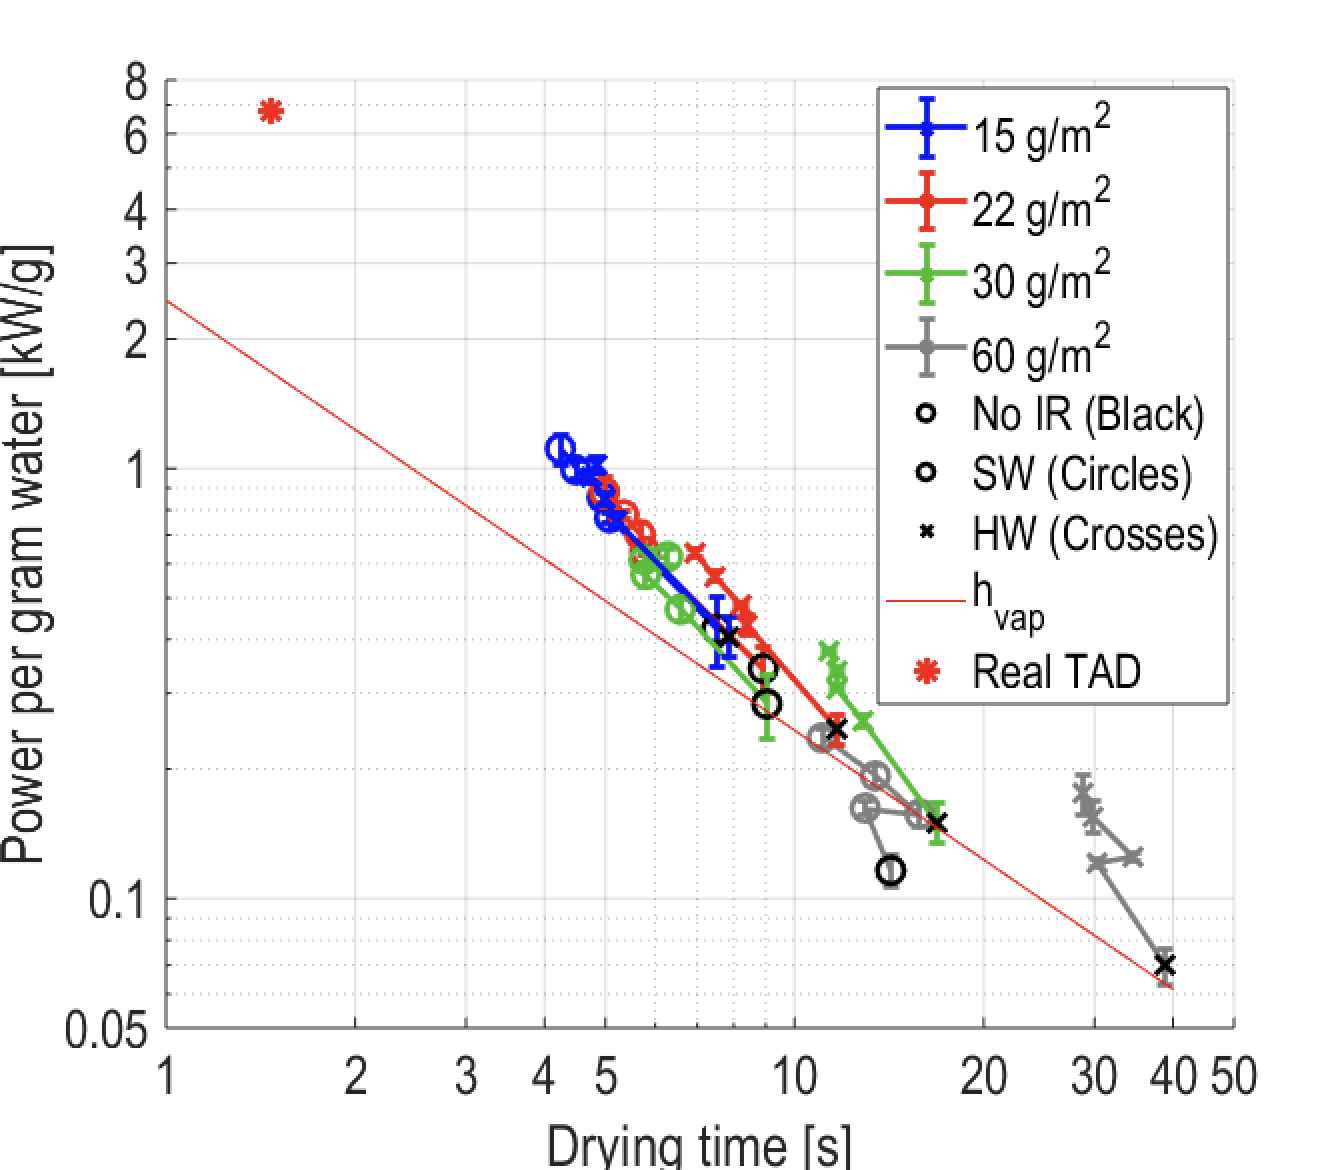
It is interesting to note that the two pulps of HW and SW, even if they showed diversity with regard to the mass of water removed, the air flow and the drying time, they are, however, very well aligned when, as a comparison, the power delivered per gram of water removed is considered. In practice, they all behave in the same way: the power supplied is low for samples with long drying times, but increases very rapidly when you try to reduce these times. This power increase, needed to speed up drying, showed itself to be non-discriminatory between the various type of pulps, weight or percentage of moisture at the start.
The samples without infrared radiation had values normally near to the theoretical power required, calculated using the latent heat of vaporisation. With the addition of infrared radiation, the energy per gram of water removed is increasingly further from the theoretical power required; this indicates lesser efficiency of energy used. Therefore, the horizontal distance from the thin red line, which represents the theoretically requested power, could be seen as a sort of efficiency of the system.
This deviation from the theoretical value seemed to extrapolate towards an efficiency similar to that of the industrial process, with the values shown in an industrial installation with TAD drying, where the air temperature even reaches 250°C, a lot higher than the 23°C of the air in the laboratory drying set. In the industrial process it must also be considered that the high drying rates of TAD installations are in part obtained by physically moving large quantities of free water which is widely present in the sheet, which is very wet when it enters the first drying section.
To conclude
The test results on the pilot scale may be useful to identify still more efficient working conditions on an industrial scale.
The addition of an infrared radiator to the experimental equipment existing with the air drying has shown itself to be effective in reducing the drying time. Times which, for all weights and pulps, have been reduced from 10 to 45%, with the highest increase with coniferous (SW) pulps, but only for the lowest weights and with a high level of radiation power. This reduction in times has not been of the same order of magnitude as the relative, more relevant, increase in energy consumption.
Even if more costly energy-wise, such a reduction in drying times may be valuable in the industrial process, in which the higher speed of the machine reduces even more the very short time in which the sheet is exposed to drying.
Having the research confirmed that an excessive air flow is not important for increasing MSDR values, transferring the results onto an industrial scale, excessive air flows can be limited. These air flows being used for through air drying in the first thermal drying section of the tissue machine with TAD technology mean a saving of energy.
For further information:
a) Infrared assisted through air drying: Aron Tysén – RISE Bioeconomy. Research Istitutes of Sweden, Bioeconomy and Papermaking & Packaging Congresso Aticelca, Maggio 2018.
b) Through air drying, thermographic studies of drying rates, drying non-uniformity and infrared assisted drying: Aron Tysén Faculty of Health, Science and Technology Chemical Engineering Doctoral thesis | Karlstad University Studies | 2018:19.
c) Method for the quantification of in-plane drying non-uniformity: Aron Tysén and Hannes Vomhoff Paper physics: Nordic Pulp & Paper Research Journal Vol 30 no (2) 2015.
d) The influence of formation on air flow through and non-uniform drying of low grammage sheets: Aron Tysén and Hannes Vomhoff Innventia Report 546 August 2014.
e) The influence of grammage and pulp type on through air drying: Aron Tysén, Hannes Vomhoff, and Lars Nilsson Paper physics: Nordic Pulp & Paper Research Journal Vol 30 no (4) 2015.
f) Interaction between fabric and web in through air drying: Aron Tysén & Hannes Vomhoff. Rise Bioeconomy, Drottning Kristinas väg 61, SE-114 28, Stockholm, Sweden. Holmen AB, Strandvägen 1, SE-114 84, Stockholm, Sweden.
g) Through air drying assisted by infrared radiation: Aron Tysén, Hannes Vomhoff & Lars Nilsson. Rise Bioeconomy, Drottning Kristinas väg 61, SE-114 28, Stockholm, Sweden. Holmen AB, Strandvägen 1, SE-114 84, Stockholm, Sweden. Chemical Engineering, Karlstad University, SE-651 88, Karlstad, Sweden.